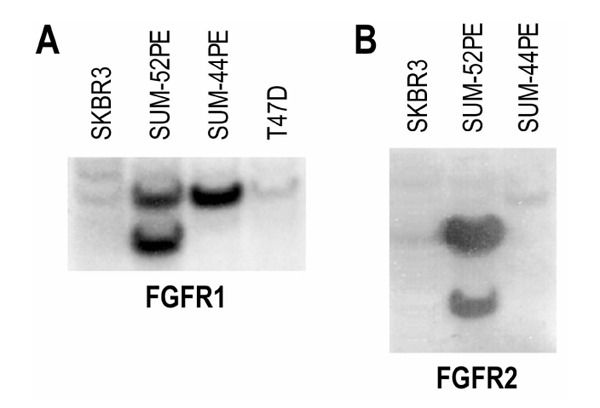
Figure 1.

Amplification of FGFR1 and FGFR2 in SUM-52PE cells. (a) Genomic DNA from four breast cancer cells lines (SKBR3, SUM-52PE, SUM-44PE, and T47D) were compared by Southern blot for FGFR1 expression. (b) Genomic DNA from three breast cancer cell lines (SKBR3, SUM-52PE, and SUM-44PE) were compared by Southern blot for FGFR2 expression.
