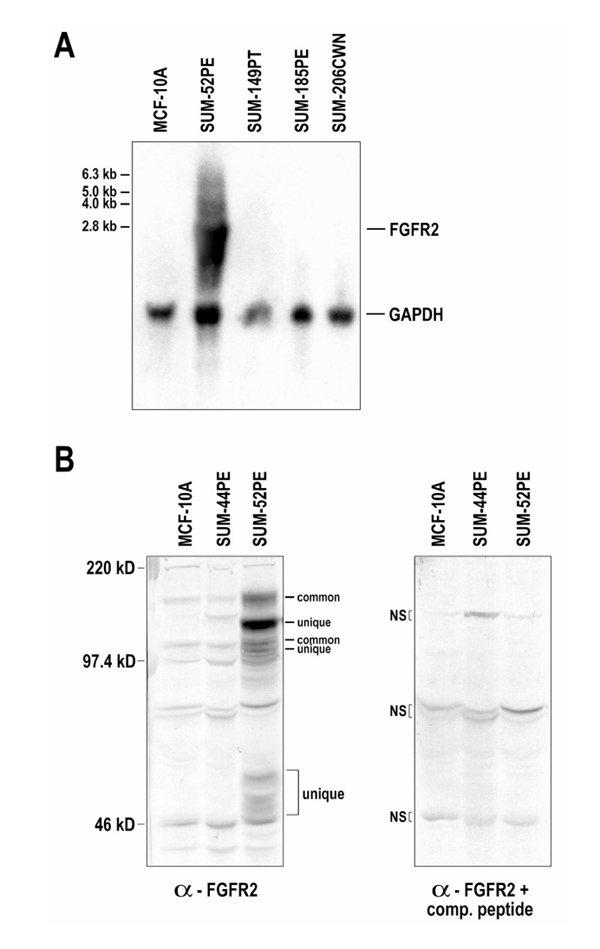
Figure 2.

Analysis of FGFR2 expression in HBC and HME cells. (a) A Northern blot probed with full-length FGFR2 is shown. A glyceraldehyde 3' -phosphate dehydrogenase (GAPDH) probe was used to normalize RNA levels. Cell lines shown are as follows: normal HME cell line (MCF-10A, lane 1) and HBC cell lines (lanes 2-5). Size of visualized bands are marked according to kilobase. (b) Whole-cell lysates were immunoblotted with an anti-FGFR2 antibody in the absence (left panel) or presence (right panel) of a competitive peptide. Breast cancer cell lines are in lanes 2 and 3, and a normal HME sample (MCF-10A) is in lane 1. All cell lines expressed two 'common' FGFR2 variants (of 95 and 135 kDa), whereas SUM-52PE expressed at least three 'unique' variants (of 46-53, 85, and 109kDa), as determined by comparison with nonspecific bands (NS; right panel).
