
Figure 2.
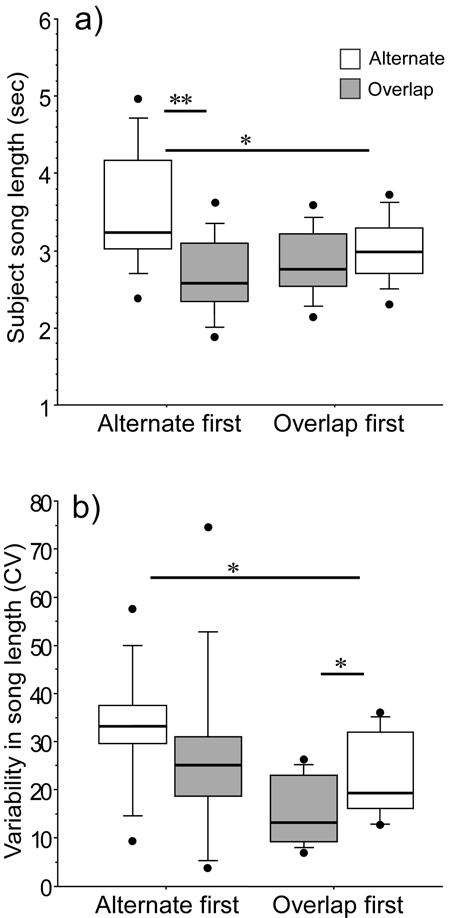
Length (a) and variability in the length (b) of male songs responded to with alternating or overlapping playback. Responses of males that received the alternating trial first are presented separately from those that received the overlapping trial first. Asterisks indicate significant post-hoc differences (** p < 0.01) and trends (* 0.05<p<0.1). Box plots enclose the interquartile range within the box – the central line shows the median, and cases in the 10th percentile at each extreme are shown as outlying points.