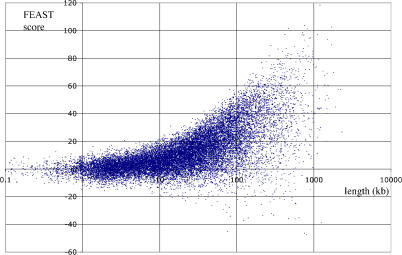
Figure 2. FEAST Reanalysis of Known Genes.
Scatterplot of FEAST scores versus gene length for known genes from the UCSC Genome Bioinformatics Site [20]. Genes overlapping known genes on the complementary strand were excluded. Scores greater than 3 are considered significant.

