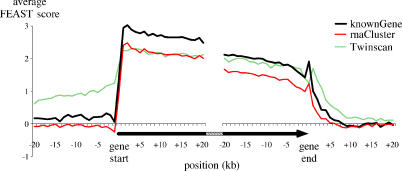
Figure 4. FEAST Scores at Gene Boundaries.
The average FEAST scores for known genes (thick black, n = 10,023), aligned at the position of gene start, show a sharp shift from nonsignificant values (near 0) outside the gene, to significant values at the 5′ end of the gene. The opposite shift is seen at the gene end, although it is more gradual. RNA cluster sequences (thin red, n = 13,749) show a very similar graph. Twinscan predictions (dashed green, n = 9,131) display positive FEAST scores outside the predicted regions, suggesting an underprediction of gene ends, particularly toward the 5′ end. Known genes, RNA clusters, and Twinscan predictions shorter than 20 kb were excluded from this analysis.

