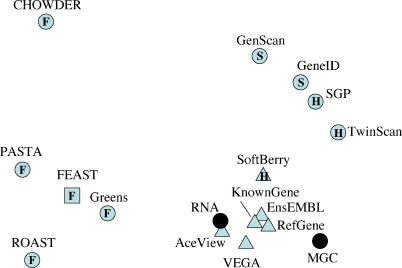
Figure 5. Genomewide Comparison of Gene Annotations.
The matrix of disagreement measures for all pairs of annotation methods is represented by point in two dimensions using MDS. Filled black circles represent experimentally observed transcripts, the vast majority being in the “RNA” set. Triangles represent methods involving significant manual curation and/or based on the RNA set. “S,” “H,” and “F” represent methods based on gene structure prediction, hybrid methods (gene structure and sequence similarity), and methods measuring footprints of transcription, respectively. The combined FEAST method was excluded from the MDS analysis, and its projected location (squared F) was calculated later (see Materials and Methods). Note that, like geographical maps of intercity distances, MDS representations have no axes.

