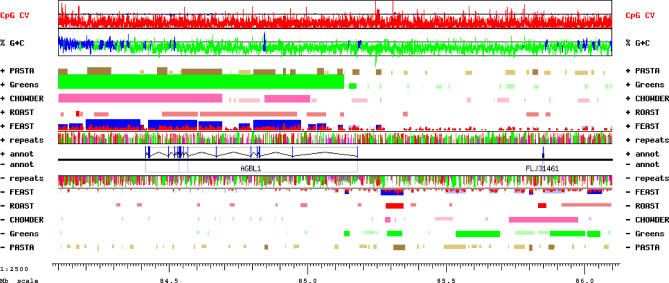
Figure 7. GESTALT View of the AGBL1 Locus between the AKAP13 and NTRK3 Genes on Human Chromosome 15, 84.1 to 86.1 Mb from the p Telomere.
PASTA, Greens, CHOWDER, and FEAST predictions are displayed for each strand in brown, green, pink, and red, respectively, with lighter shades indicating less significant scores. In the FEAST track, actual scores are indicated in red, and maximal segments are displayed in blue. The AGBL1 gene structure was modeled based on translated sequence similarity to the AGTPBP1 protein.

