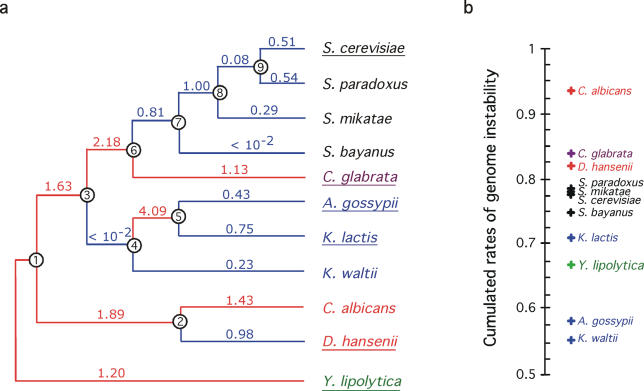
Figure 2. Rates of Genome Instability in Hemiascomycetes.
(A) Branch-specific normalized rates of genome rearrangements are indicated either in red or in blue illustrating higher or lower rates than average, respectively. Nodes are numbered from 1 to 9.
(B) Cumulated rates of genome instability correspond to the ratios between the sum of the branch-specific GOL and the phylogenetic distance separating each species from node 1 (Table 2).

