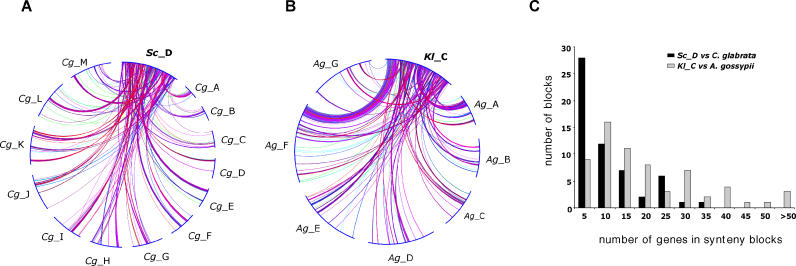
Figure 4. Chromosomal Map Reorganization between Related Species.
The circular representation is adapted from [25].
(A) Chromosome D from S. cerevisiae (Sc_D) is represented in a circle with the 13 chromosomes from C. glabrata (Cg_A to M). Each line joins two orthologs and the color of the lines represents the percentage of similarity between orthologous gene products (green ≤ 50% ≤ cyan ≤ 60% ≤ blue ≤ 70% ≤ magenta ≤ 80% ≤ dark magenta ≤ 90% ≤ red).
(B) Same representation between chromosome C of K. lactis (Kl_C) and the seven chromosomes from A. gossypii (Ag_A to G). The diagram shows large uninterrupted regions of conserved synteny between Kl_C and Ag_F or Ag_A, while no such conservation is visible between Sc_D and any of the C. glabrata chromosomes.
(C) Distribution of the length of the corresponding syntenic blocks between Sc_D and C. glabrata (black) and Kl_C and A. gossypii (gray).

