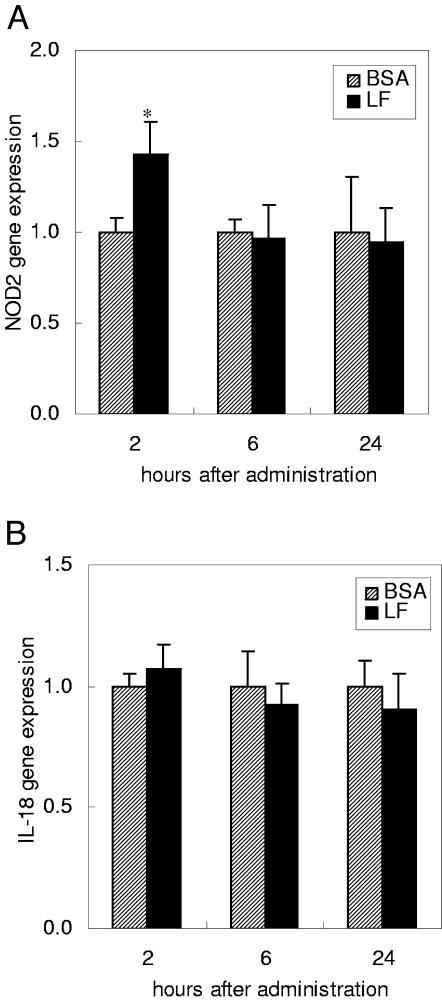
FIG. 5.
Time course of gene expression of NOD2 (A) and IL-18 (B) in the small intestines of mice. The gene expression levels were estimated by quantitative RT-PCR 2, 6, and 24 h after administration of BSA or LF. Data are means ± SEM for 4 to 10 animals from two independent experiments. *, P < 0.05.

