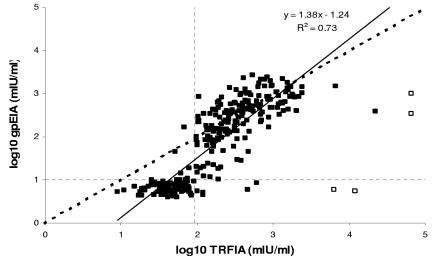
FIG. 3.
Scatterplot comparing VZV IgG levels measured by TRFIA and Merck glycoprotein EIA for 298 sera collected from a London Hospital routine laboratory. The dotted lines denote the cutoff points, while the bold dotted line denotes the line of equivalence (y = x). Open squares denote potential outliers.

