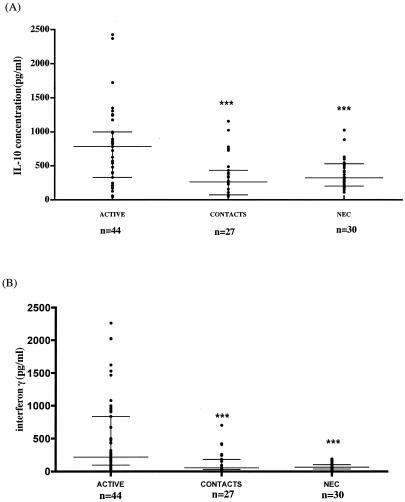
FIG. 1.
IL-10 (A) and IFN-γ (B) production in active Buruli ulcer patients, household contacts, and NEC after stimulation of whole blood with an M. ulcerans 1 sonicate. ***, P values of <0.05, referring to comparison with active M. ulcerans disease patients. The horizontal lines represent the median and the interquartile range. Each dot represents a subject.

