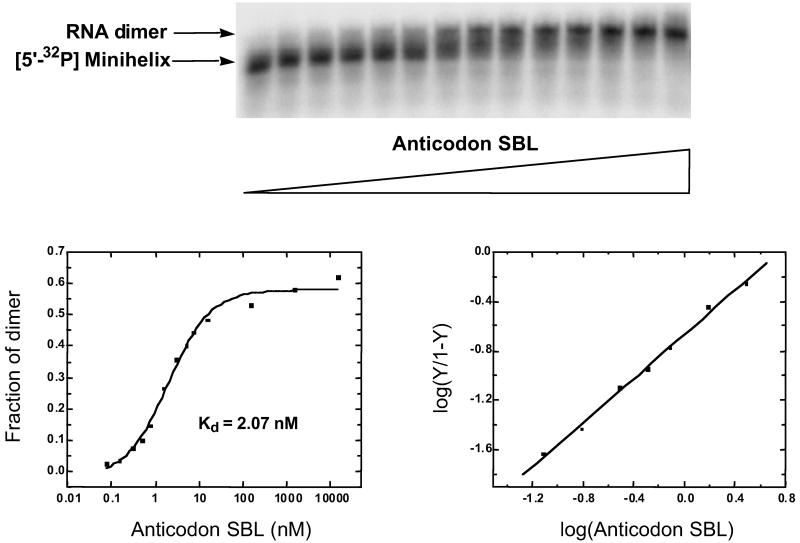
Fig 2.
Formation of the RNA dimer complex through complementary loop–loop interactions. A gel retardation assay was carried out at pH 7, 4°C, with 5′-32P-labeled minihelix 35-mer (≈1 nM) in which unlabeled anticodon SBL was added in increasing concentrations from 0 to 15.5 μM. The shifted band was quantified and plotted on a logarithmic scale to obtain the binding profile shown on the left. The corresponding Hill plot is shown on the right.

