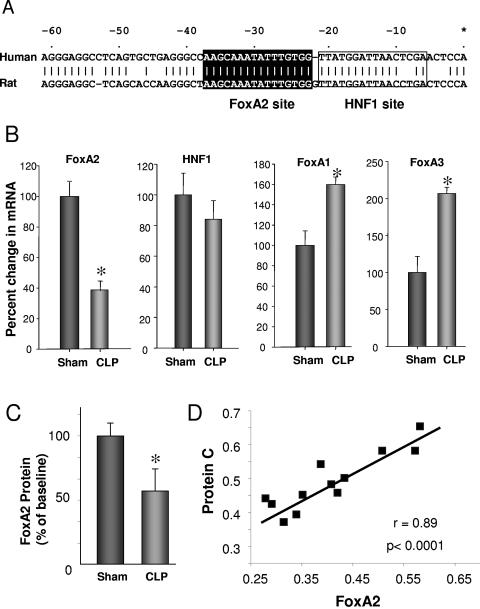
FIG. 2.
Comparison of the PC promoter region of the human and rat. (A) Analysis of the upstream region of the human and rat PC genes with MatInspector, which identified the noted FoxA2 (perfect match to the core; matrix score of 0.993) and HNF1 binding sites. The numbering is relative to the transcription start site of the human PC gene. (B) Change in expression of transcription factors FoxA1, -2, and -3 and HNF1 at 22 h after induction of sepsis by CLP determined by qPCR (TaqMan). Eight animals per group were used for determining Fox factors, 13 animals were used for sham conditions, and 14 animals were used for CLP for HNF1 analysis. *, P < 0.05. (C) Inhibition of FoxA2 by immunoassay following CLP. *, P < 0.05. (D) Relationship of levels of FoxA2 and PC mRNA at 22 h after induction of sepsis by CLP. Values are the ratio of the GOI over the 18S control as described in the legend to Fig. 1.

