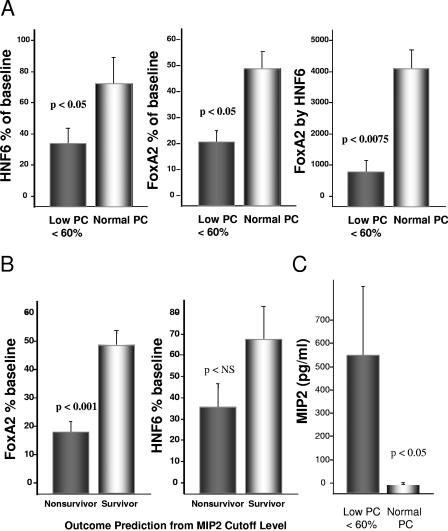
FIG. 4.
FoxA2, PC, and mortality predictors. (A) Relationship of HNF6 and FoxA2 to predictive plasma PC cutoff values for outcomes. Data are means ± SE for 14 animals. The cutoff value of 60% of the pre-CLP baseline was determined as described above by receiver operator characteristic curve analysis generated from the logistic regression model in the JMP5.1 software package. (B) Levels of FoxA2 and HNF6 expression in animals predicted to be survivors or nonsurvivors by MIP2 levels. Plasma samples were analyzed at baseline and 22 h post-CLP for MIP2 by ELISA. Data are means ± SE for 14 experiments. (C) Analysis of MIP2 plasma levels as a function of PC plasma levels. The measurement of MIP2 was by immunoassay, as previously described (12).

