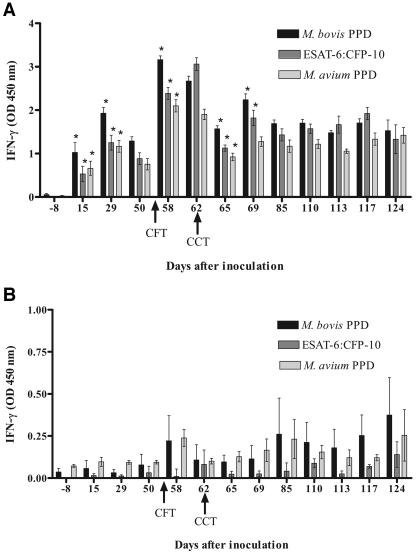
FIG. 1.
Longitudinal IFN-γ response to M. bovis PPD, M. avium PPD, or rESAT-6-CFP-10 fusion protein. Values represent the mean responses to each antigen (24-h stimulation) minus the response to medium alone ± standard error of the mean (error bars) for 10 M. bovis-inoculated calves (A) or 5 noninoculated control calves (B). Day 0 represents the day of inoculation. Arrows represent time points when purified protein derivative was injected for tuberculin skin testing. *, significantly different than the previous time point (P < 0.05). OD, optical density.

