
FIGURE 2.
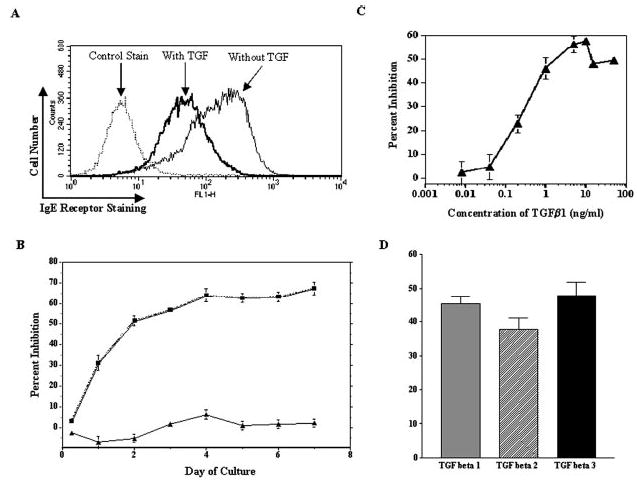
TGF-β1 inhibits mouse mast cell FcεRI expression. A, BMMC were cultured for 3 days in IL-3 and SCF with or without TGF-β1, after which FcεRI surface expression was assessed by flow cytometry. Control staining was with FITC-anti-IgE staining in the absence of IgE. Data shown are a representative histogram from one of 42 experiments using 15 BMMC populations. B, Time course of TGF-β1-mediated inhibition. BMMC were cultured as described in A for the indicated times, after which surface FcεRI expression was assessed by flow cytometry. Percent inhibition was determined by comparing the mean fluorescence intensities of cells cultured in IL-3 with and without TGF-β1. Data shown are the mean and SE of 6–18 samples/point. C, Concentration-dependent effects of TGF-β1 on mouse FcεRI expression. BMMC were cultured as described in A for 3 days. Percent inhibition of FcεRI expression was determined by comparing surface staining of cells cultured in IL-3 with that of cells cultured in IL-3 and TGF-β1. Data shown are the mean and SE from six samples. D, BMMC were cultured for 3 days in IL-3 with or without TGF-β1, TGF-β2, or TGF-β3 (5 ng/ml each). The percent inhibition of surface FcεRI expression was determined as described in B, using six BMMC populations. When comparing the percent inhibition induced by each stimulus, p > 0.05.