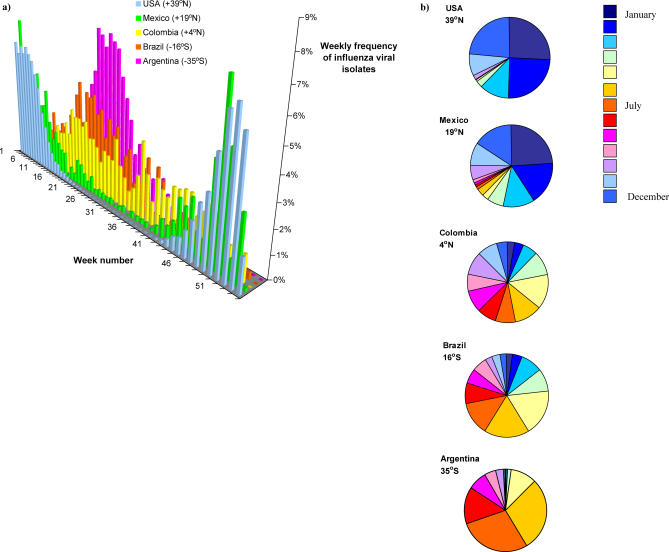
Figure 1. Comparison of Influenza Seasonal Patterns in Temperate and Tropical Countries in the Americas (From Lat +39°N to -35°S) The latitude of the capital city is indicated for each country in the legend.
(A) Weekly distribution of influenza laboratory isolates (from week 1 to week 52; weekly frequency ( y-axis) is calculated as the weekly number of isolates divided by the annual number of isolates).
(B) Weekly numbers of isolates were aggregated over four-week periods to show a (nearly) monthly distribution of influenza circulation. Each color represents a different month (color bar on the right). Note the transition in seasonal patterns from north to south, ranging from marked seasonal winter activity centered around January in the US, to uniform circulation throughout the year in Columbia and again, strong winter epidemics center around July in Argentina.
Influenza viral surveillance data compiled from WHO Flunet.

