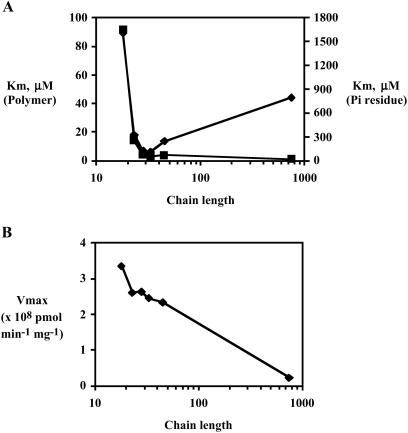
Fig 4.
Km and Vmax values with poly P of various chain lengths. The assay mixture contained 50 mM Hepes-KOH (pH 8.0), 80 mM (NH4)2SO4, 10 mM MgCl2, 1 mM [8-3H]GDP (20 cpm/pmol), various concentrations of poly P, and various amounts of PPK2 (Fraction 6 in Table 1). Poly P chain lengths were poly P18 (18 ± 2), poly P23 (23 ± 3), poly P28 (28 ± 5), poly P33 (33 ± 6), poly P45 (45 ± 8), and poly P750 (as described in ref. 13). For more details, see Fig. 5 legend. In each case, the Km and Vmax were determined by a Lineweaver–Burk plot (data not shown). (A) Km values for poly P: squares for molar concentration, diamonds for Pi residue concentration. (B) Vmax values with various chain lengths.

