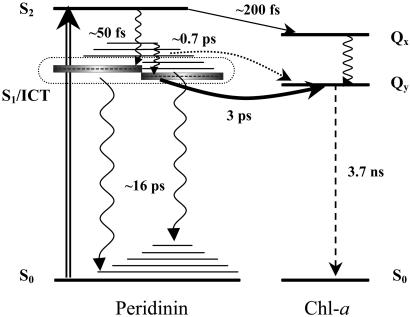
Fig 4.
Scheme of energy levels and energy transfer pathways between peridinin and Chl-a in the PCP complex. Intramolecular relaxation processes are denoted by wavy arrows, whereas the dashed arrow represents the long-lived Chl-a fluorescence. Solid arrows represent energy transfer channels: (S2→Qx channel, 25%; S1/ICT→Qy channel, 63%). The dotted line represents a possible minor energy transfer channel involving higher vibrational levels of the S1/ICT state. Excitation at 535 nm is shown as a double arrow. All processes are labeled by a corresponding time constant. See text for details.

