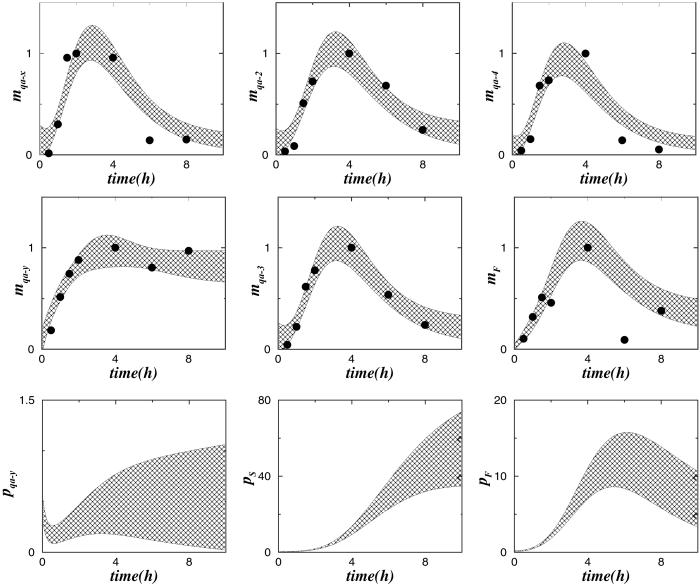
Fig. 5.
Comparison of experimental and ensemble model dynamics of mRNAs of the qa cluster. The dots are the data derived from Fig. 3. The shadowed areas enclose 4 ensemble standard deviations of mx, for x = F, S, sg, centered around the ensemble mean of mx. Also shown are the corresponding ensemble predictions for several protein levels px.

