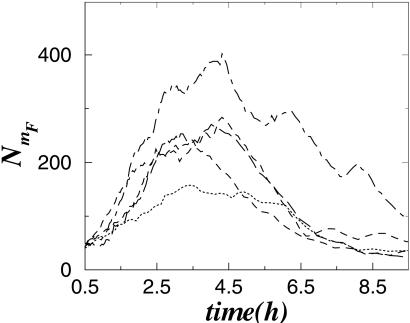
Fig. 6.
Dynamics of the total number of qa-1F mRNA molecules, obtained by simulations of the stochastic model corresponding to Eq. 1, as described in the text. Different realizations of the stochastic model trajectory generate patterns with maxima located near 4 h in accordance with experimental data in Fig. 3.

