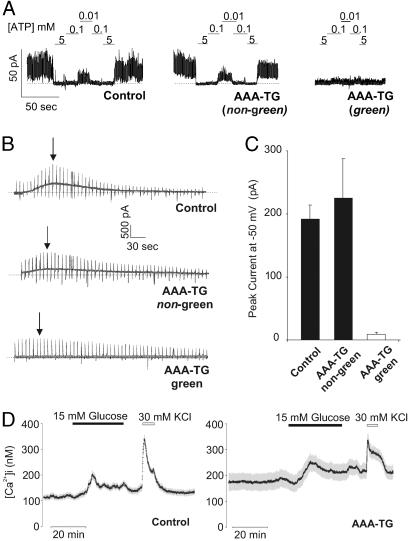
Fig 3.
Green fluorescing AAA-TG beta cells exhibit no detectable KATP channel activity and elevated [Ca2+]i. (A) Representative KATP currents recorded in inside-out membrane patches from littermate control and AAA-TG beta cells. Patches were exposed to differing ATP concentration as shown. A heterogeneous population of beta cells was observed in the transgenic islets with no KATP channel activity in the beta cells expressing Kir6.2[AAA]-GFP (green, ≈70%) and the remaining cells (nongreen, ≈30%) displaying wild-type KATP channels, with respect to channel density and ATP sensitivity. (B) Representative macroscopic K+ current recorded from whole beta cells after dialysis with zero ATP solution (0.5-s ramps from −90 mV to +20 mV delivered every 5 s; holding potential, −50 mV). Peak currents for representative traces are indicated (arrows). (C) Averaged peak K+ currents at −50 mV for AAA-TG (green, n = 8; nongreen, n = 4) and control beta cells. (D) Representative recordings of [Ca2+]i (symbols; ±SEM) for multiple cells in a field (n = 28 and 35, respectively) from a single AAA-TG or control mouse. Cells were exposed to 3 mM glucose or 15 mM glucose, or 30 mM KCl, as indicated. Qualitatively similar results were observed in beta cells from three additional pairs of control and AAA-TG mice.

