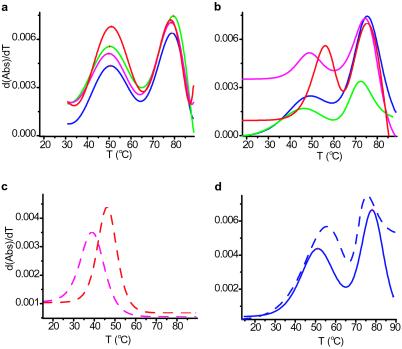
Fig 3.
Comparison of the relative stabilities of P2b, P2b-dys, and the “trans-pseudoknot.” (a) Derivative of UV melting curves for P2b (blue; Tm = 50.6°C, 78.8°C), P2b:P3 (magenta; Tm = 49.9°C, 78.5°C), P2b:P3-mutant (red; Tm = 51.0°C, 78.5°C), and P2b:CR5 (green; Tm = 50.3°C, 79.5°C) in equimolar ratios, each oligonucleotide at 2.4 μM. (b) Same as in a but RNA at 275 μM. P2b (Tm = 48.7°C, 77.7°C), P2b:P3 (Tm = 46.1°C, 75.5°C), P2b:P3-mutant (Tm = 58.6°C, 79.2°C), and P2b:CR5 (Tm = 46.0°C, 73.4°C). (c) Short double-stranded RNA constructs 1/2P2b:P3 (dashed magenta; Tm = 38.7°C) and 1/2P2b:P3-mutant (dashed red; Tm = 46.0°C). (d) Comparison of melting curve derivatives for P2b (blue, Tm = 50.6°C, 78.8°C) and P2b-dys (dashed blue, Tm = 54.2°C, 77.0°C). After dialysis against NMR buffer, 1 mM MgCl2 was added in each case, resulting in a lower Mg-to-RNA ratio for the high RNA concentration samples. Notice in a and b a lower Tm at a high concentration for each P2b domain.

