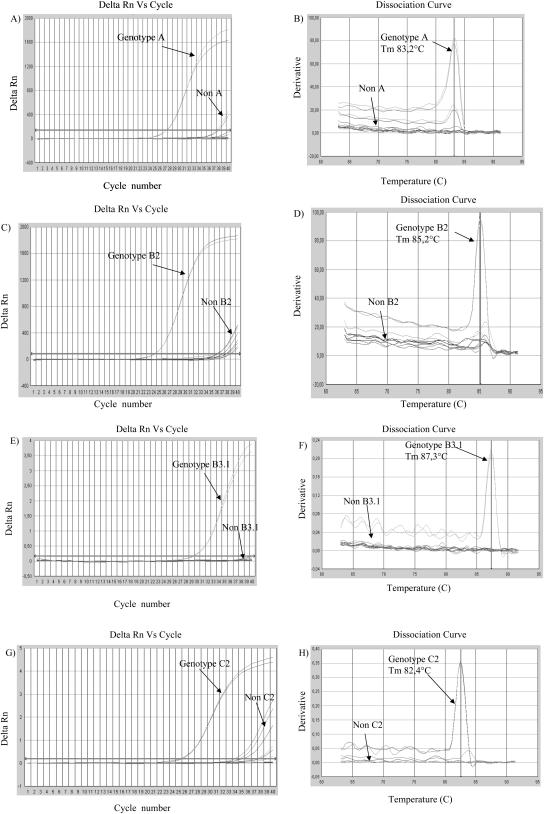
FIG. 2.
Genotyping experiment based on RT-ARMS PCR using SYBR green. Different samples of MV genotypes A, B2, B3.1, B3.2, C2, and D7 were tested. The amplification curves of the isolates that reacted with primers specific for genotype A (A), genotype B2 (C), genotype B3.1 (E), and genotype C2 (G) are indicated, including a representative nonreactive isolate from each genotype and a no-template reaction. On the corresponding dissociation curves (B, D, F, and H), the melting temperature (Tm) for each genotype has been indicated with a vertical line. Delta Rn, relative fluorescence.

