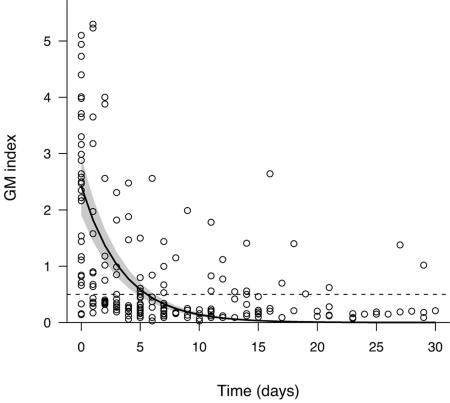
FIG. 2.
GM index decrease during the month after the cessation of antibiotherapy. The solid line represents the population average kinetics as estimated by use of a nonlinear mixed regression model with a pointwise 95% confidence band (shaded region). Circles represent individual GM index values measured during this period, and the dashed line represents the 0.5 threshold for positive indices.

