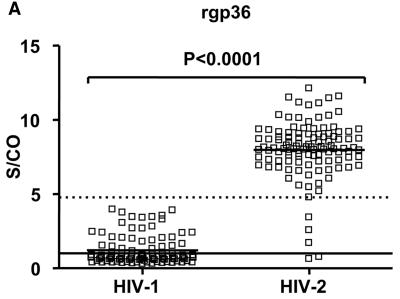
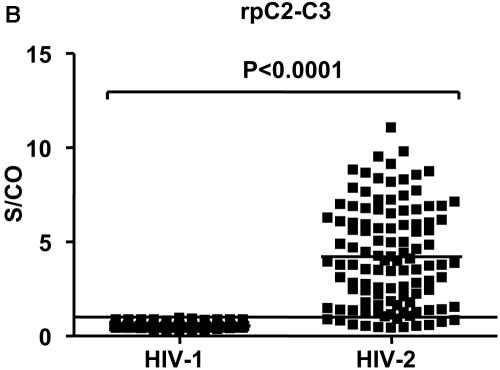
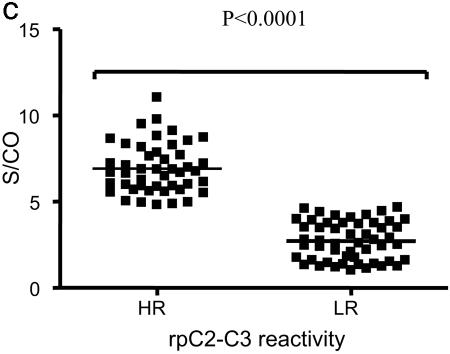
FIG.1.
Patterns of reactivity of HIV plasma samples with rgp36 and rpC2-C3. Reactivity of HIV-1 and HIV-2 samples with rgp36 (A) and rpC2-C3 (B). (C) Low (LR) and high (HR) rpC2-C3 responders. S/CO, ODsample/ODcutoff ratio. Reactivity to rgp36 and rpC2-C3 is indicated by open (□) and black (▪) squares, respectively. The horizontal solid line represents the cutoff value; samples with S/CO values of ≥1 are considered reactive. The dotted line represents the lower S/CO value obtained with HIV-2 samples for rgp36. Student's t test was used to compare mean S/CO OD values obtained for both antigens.


