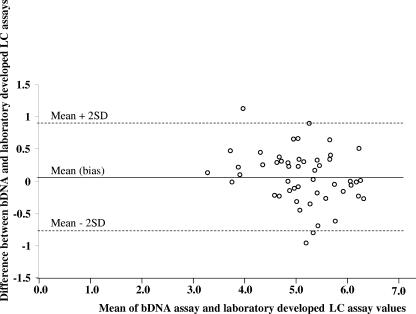
FIG. 2.
Differences between the mean loads measured by the branched DNA assay and real-time RT-PCR by using the Bland-Altman plot analysis. The mean difference (bias) is indicated by a solid line, and the 95% confidence interval (±2 standard deviations) is represented by dotted lines. The mean difference ± standard deviation was 0.07 ± 0.41 log10 copies/ml.

