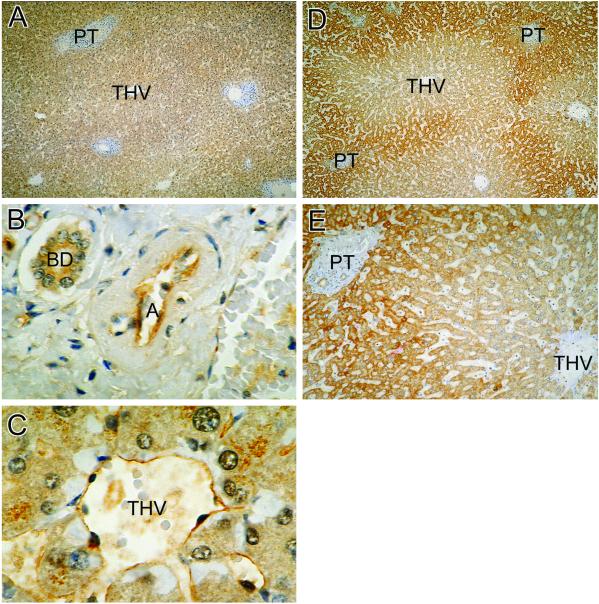
Fig 2.
The distribution of eNOS and iNOS in normal liver as shown by immunohistochemistry. (A) Homogenous distribution of eNOS immunoreactivity in hepatocytes. THV, terminal hepatic venule; PT, portal triad (×40). (B) The presence of eNOS in the epithelial cells of biliary duct (BD) and in the endothelium of hepatic artery (A) (×400). (C) The eNOS in THV and sinusoids (S) (×400). The iNOS immunoreactivity is strongly expressed in the cytoplasm of hepatocytes surrounding the portal triad (PT), but not those associated with the terminal hepatic venule (THV). (D, ×40; E, ×100, respectively.)

