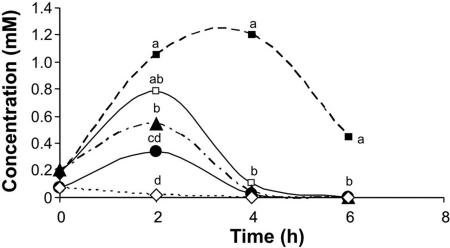
FIG. 1.
Effect of pH on ammonia secretion by C. gloeosporioides. Samples of medium were quantified for ammonia accumulation at different times after transfer to secondary medium containing KNO3, buffered with phthalate buffer to a pH range of 4.0 to 7.0. Symbols: ▪, pH 4; □, pH 5; ▴, pH 6; •, pH 6.5; ⋄, pH 7. Significance was calculated by comparing the concentrations of ammonia at the different initial pHs on each sampling day and was analyzed statistically by analysis of variance of three replications. Values for points on the same day labeled with the same letter were not statistically different (P < 0.05).

