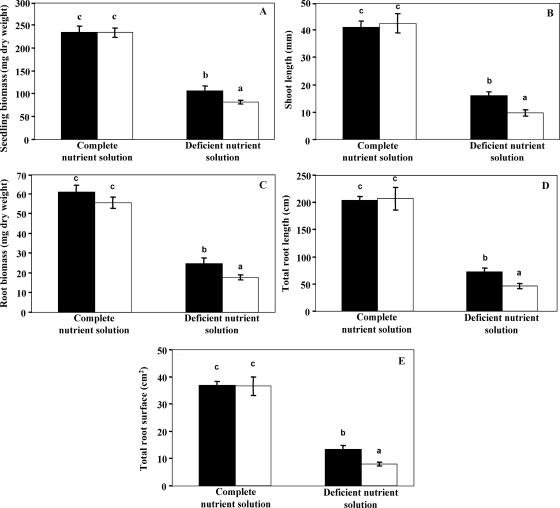
FIG. 6.
Growth of the plants during the 102 days of the greenhouse experiment in the different treatments. (A) Total seedling biomass; (B) shoot length measured above cotyledons; (C) root biomass; (D) total the root length; (E) total root surface area. Black plots correspond to plants inoculated with the bacterial strain PML1(12), and white ones correspond to noninoculated plants. Each plot is a mean value of results from 10 replicates. Bars represent standard deviations. For each variable, treatments associated with the same letter are not significantly different according to a one-factor (bacterial treatment) ANOVA (P = 0.05) and the Bonferroni-Dunn test.

