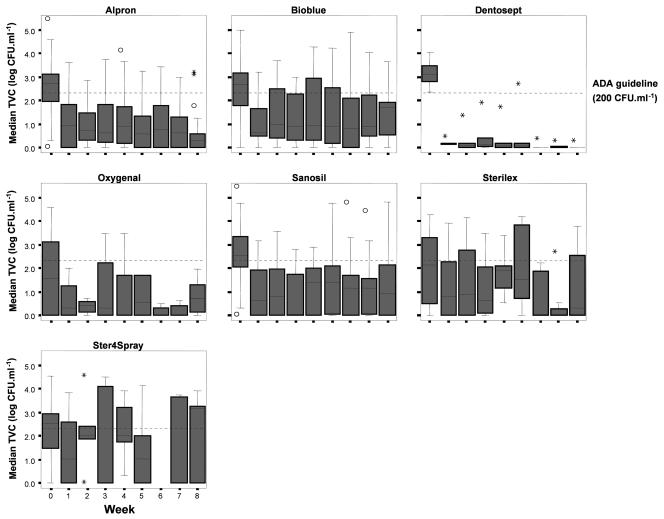
FIG. 2.
Longitudinal analysis of water TVCs during 8 weeks of disinfection of DUWS. Disinfection starts at week 1; week 0 represents the median baseline value. Median values are shown as black lines in the boxes. The boxes represent the interquartile ranges, and the whiskers indicate the minimum and maximum values up to 1.5 times the IQR (made with SPSS 12.0.1 for Windows). ○, outlier value (between 1.5 and 3 times the IQR); *, extreme value (more than 3 times the IQR).

