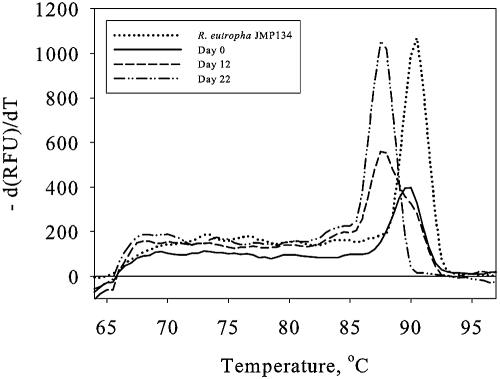
FIG. 6.
Melting profiles of real-time PCR amplification products of soil DNA from days 0, 12, and 22 in Top20 using the tfdA-II primer set and the QuantiTect SYBR green PCR kit. Furthermore, the melting profile of the PCR amplification product from the tfdA-containing strain R. eutropha JMP134 is shown. The profile displays the negative first derivative of temperature versus relative fluorescence units (RFU) [−d(RFU)/dT] plotted against temperature.

