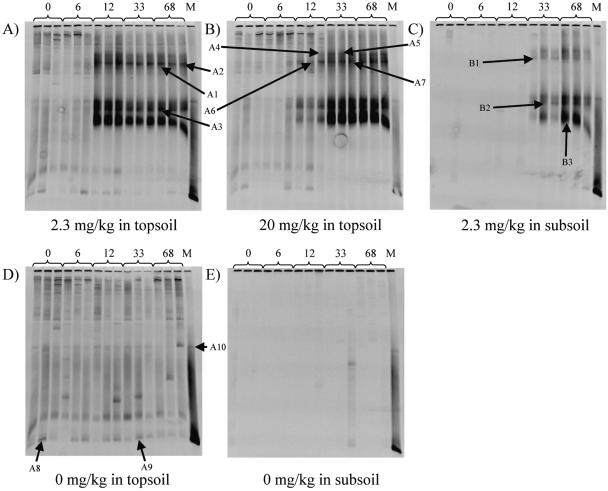
FIG. 7.
Functional diversity of MCPA degrader genes using PCR/DGGE analysis with the tfdA** primer set. The gene product was separated using 55 to 70% urea gels. DNA extracts from days 0, 6, 12, 33, and 68 were analyzed in real triplicates. For the marker profile (M), DNA extracts from soil samples inoculated with the tfdA-containing strain R. eutropha JMP134 were used. A1 to A10 indicate bands selected for sequence analysis from topsoil DNA, and B1 to B3 indicate bands selected for sequence analysis from subsoil DNA. A shows the DGGE profile of DNA extracted from Top2.3, B shows the DGGE profile of DNA extracted from Top20, and C shows the DGGE profile of DNA extracted from Sub2.3. D shows the DGGE profile of DNA extracted from Top0, and E shows the DGGE profile of DNA extracted from Sub0.

