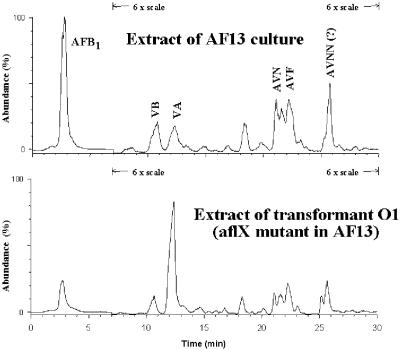
FIG. 4.
LC-MS analysis of metabolite extracts from AF13 niaD mutant and transformant O1 cultures. Identification of metabolites was by elution times and comparison of ion peaks from MS to peaks from authentic samples. The scale was 1× for detection of AFB1 and 6× for detection of the other metabolites, as shown on the plot.

