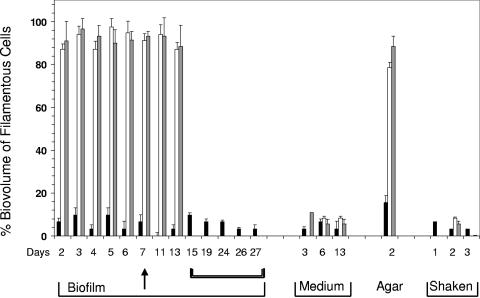
FIG. 3.
Percentage of biovolumes represented by filamentous cells within various L. pneumophila Knoxville-1 cultures. Black bars represent growth at 25°C, white bars represent growth at 37°C, and gray bars represent growth at 42°C. The arrow indicates the point at which detachment of biofilms at 37°C and 42°C occurred. Double brackets indicate days when only 25°C biofilms were assessed. Values are presented as means ± SD of triplicate data. Statistical analysis was performed using Student's t test to compare the differences between groups, and P values of <0.05 were considered statistically significant.

