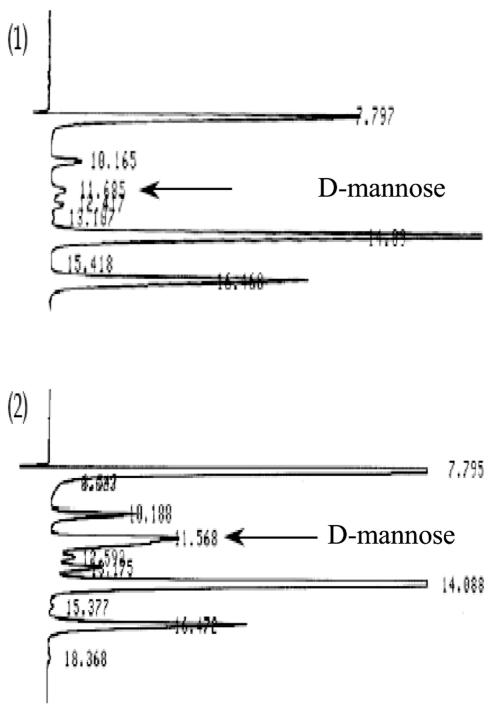
FIG. 2.
HPLC diagram of the conversion of AM to d-mannose by cell extracts of S. morelense S-30.7.5. For details, see Materials and Methods. The arrow indicates the elution peak of d-mannose at 11.6 min as the conversion product of AM at 14.1 min. 1, after 10 min of incubation; 2, after 25 min of incubation.

