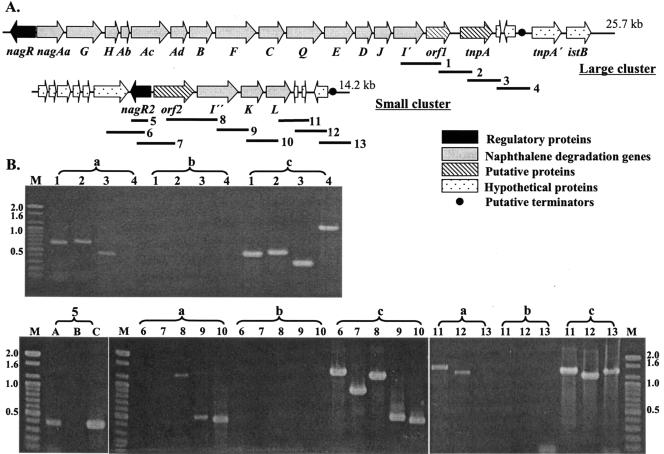
FIG. 3.
Physical maps of naphthalene degradation genes from P. naphthalenivorans strain CJ2 and of RT-PCR analysis of expressed genes. (A) Gene order in large and small naphthalene catabolic clusters. Bold solid lines show locations of 13 primer pairs used in the RT-PCR assays. (B) Agarose gel electrophoresis of 13 RT-PCR products amplified from strain CJ2 grown on naphthalene. Numbers refer to the locations of PCR fragments shown in Fig. 3A. Lowercase letters refer to amplification conditions: a, RT-PCR products from total RNA; b, PCR products from total RNA without RT; c, PCR products from genomic DNA. M, molecular size marker (100-bp ladder).

