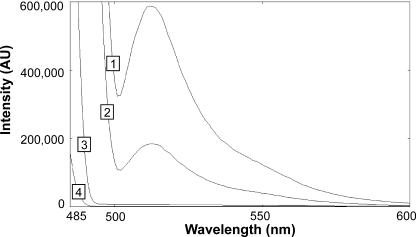
FIG. 1.
Emission spectra (excitation at 485 nm) of 0.4 OD600 units of transformed (pPPMA1-GFP and pPPMA1-GFP/PEST, respectively) and nontransformed cells were compared to the emission spectrum of pure water. Cells were harvested by centrifugation, washed, and resuspended in sterile water. Spectrum 1 represents the light emission of cells expressing native GFP, spectrum 2 indicates the fluorescence emission of cells transformed with destabilized GFP/PEST, and spectrum 3 nontransformed cells and spectrum 4 pure water. The GFP emission maximum is at 511 nm. The steady-state fluorescence was reduced to ca. 30% by addition of the PEST degradation signature.

