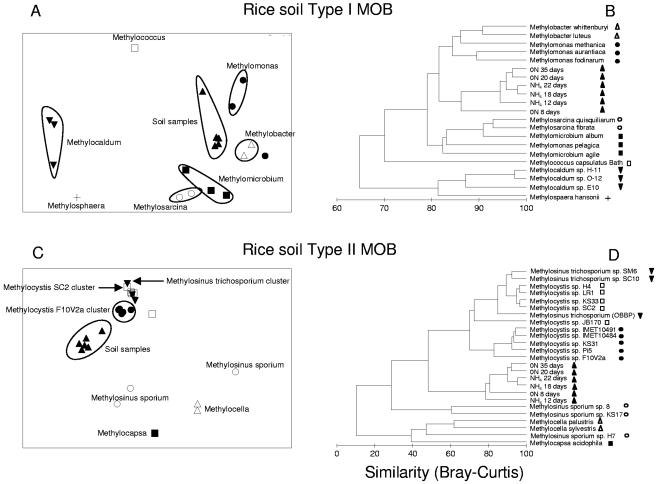
FIG. 5.
Multivariate statistical analyses of SIP 13CH4-PLFA profiles of the MOB community in rice field soil samples. The inputs of the MDS (A and C) and the cluster analyses (B and D) were PLFA profiles of MOB cultures (expressed as percentage of total PLFA content) and of SIP profiles of soil samples (expressed as percentage of 13C incorporated in separate PLFAs of the total PLFA 13C uptake). The two-dimensional distances between samples in the MDS graph show the relative similarity between samples. Stress values of the MDS plots were 0.13 (A) and 0.10 (C). For the cluster analyses, the profiles were transformed [log(x + 1)] before the Bray-Curtis similarity matrix was established. The clustering was done using the group average linking method (11).

