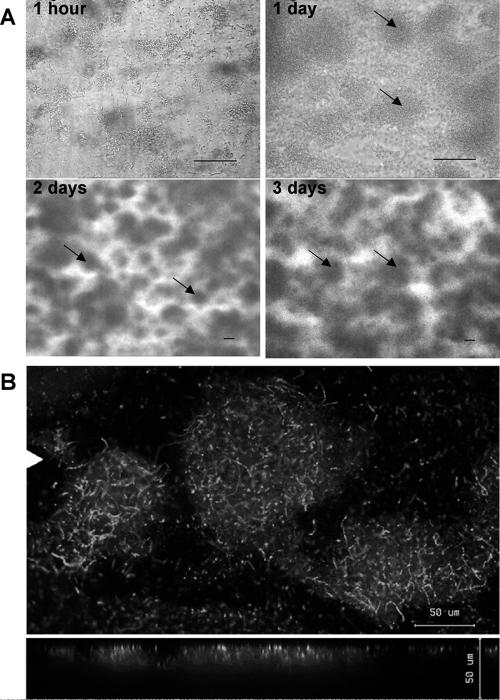
FIG. 1.
Z. mobilis biofilm morphology in flow cells. (A) Phase-contrast images showing initial attachment and subsequent biofilm development during 3 days of Z. mobilis growth at a constant flow rate of 0.15 ml min−1 at room temperature. The arrows indicate microcolonies. (B) CLSM images of 3-day-old Z. mobilis biofilms stained with the BacLight LIVE/DEAD viability stain. The top and bottom images are topical and vertical views of Z. mobilis microcolonies. The white triangle in the top image indicates the position where the vertical section of the biofilm was taken. Bars, 50 μm.

