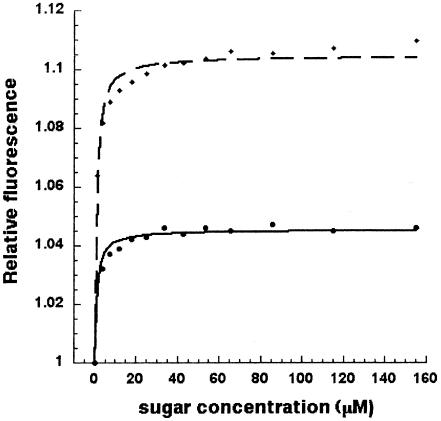
FIG. 1.
Relative fluorescence of BglE in response to the addition of increasing amounts of laminaribiose (dashed line) and cellobiose (solid line). The protein concentration was 0.3 μM in 50 mM sodium phosphate (pH 7.0). For this measurement, the excitation wavelength was 280 nm and the emission wavelength was 335 nm.

