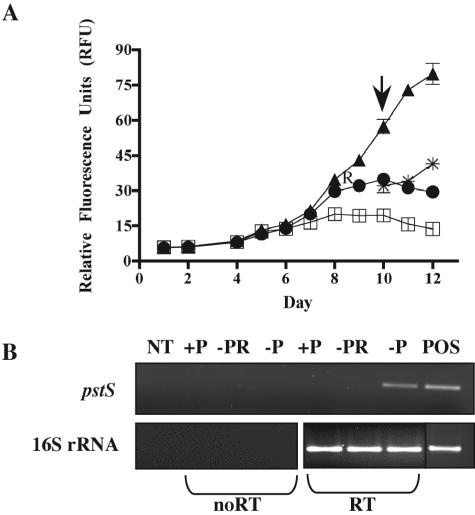
FIG. 2.
Expression of pstS (400876370). (A) A growth curve, plotted as relative fluorescence units, of axenic Crocosphaera watsonii WH8501 in SN medium with 45 μM (triangle), 1 μM (circle), or no added (square) phosphate. The “R” indicates where the 1 μM culture was refed (*) to 45 μM. Arrow indicates where samples for gene expression were harvested. Error bars denote the standard error from the mean (n = 3). (B) Expression of the 289-bp pstS amplicon and the 392-bp 16S rRNA amplicon. Lane designations are as follows: NT (no template), +P (cDNA from a P-replete culture, harvested as designated), −PR (cDNA from a P-starved culture refed to replete levels of P, harvested as designated), −P (cDNA from a P-starved culture, harvested as designated), POS (DNA from a P-replete culture). Samples transcribed without or with reverse transcriptase are designated noRT or RT, respectively.

