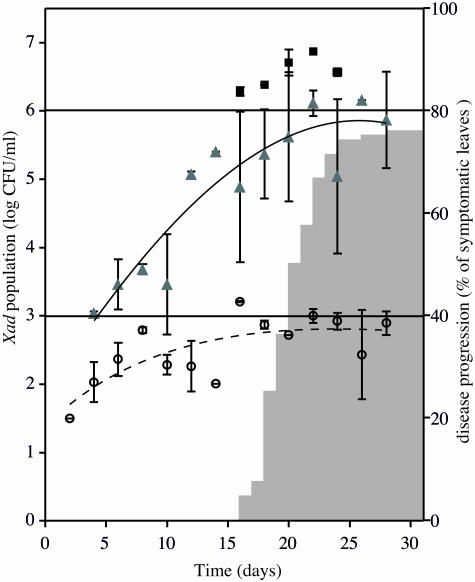
FIG. 2.
Evaluation of the sensitivity of nested PCR and the delay between molecular detection and visual development of the disease. Leaf sections of infected anthurium were subjected to population size determination and nested PCR detection as described in the text. The symbols indicate means of the population sizes, and the error bars indicate standard deviations. Symbols: ○, X. axonopodis pv. dieffenbachiae (Xad) population sizes in leaf sections when no detection by nested PCR was observed; ▴, X. axonopodis pv. dieffenbachiae population sizes in leaf sections when there was nested PCR detection only after the second round of amplification; ▪, X. axonopodis pv. dieffenbachiae population sizes in leaf sections when there was nested PCR detection after the first and second rounds of amplification. The temporal progress of disease incidence is indicated by gray columns.

