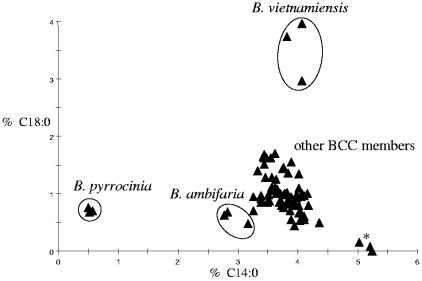
FIG. 2.
Relationships among fatty acid profiles depicted in the two-dimensional plot according to the diagnostic fatty acids C14:0 and C18:0, which were present in all BCC type strains and 47 clinical isolates. The asterisk indicates the B. multivorans type strain. For fatty acid profiles used in the two-dimensional plot, strains were cultivated along conditions for the TSBA50 standard library. Reproducibility was ensured by three independent analyses of each strain tested.

