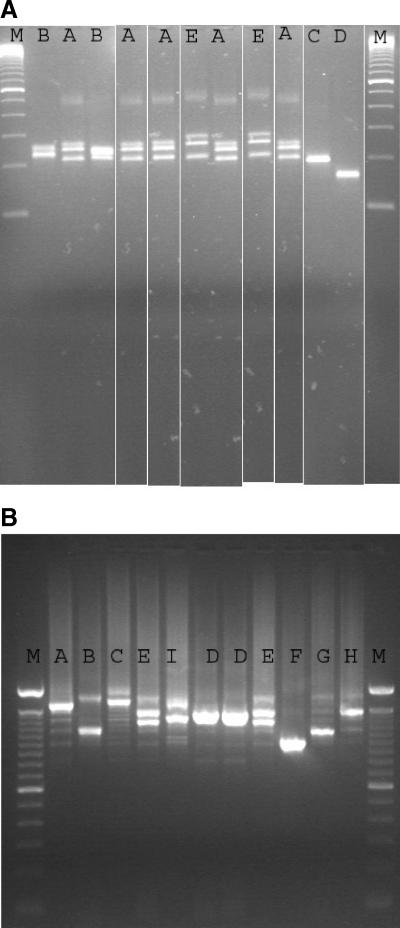
FIG. 1.
(A) Profiles of CKTNR tests of all but one identified genotypes. The CKTNR assay generated six genotypes (A through F). Lane 1 (M) shows the molecular size markers. Lanes 2 to 11 give genotypes 1 to 10, respectively (genotype 11 is missing); lane 12 shows genotype 12. Genotypes are identified by combining the two tests (see panel B). Mark that there is no distinction between genotypes 1 and 3, genotypes 2, 4, 7, and 9, and genotypes 6 and 8 by using the CKTNR test. (B) Profiles of CKRS1 tests of all but one of the identified genotypes. The CKRS1 test identified nine genotypes (A through I). Lane 1 (M) shows molecular size markers. Lanes 2 to 11, genotypes 1 to 10, respectively (genotype 11 is missing); lane 12 shows genotype 12. Genotypes are identified by combining the two tests. Mark that there is no distinction between genotypes 4 and 8 and genotypes 6 and 7 by using the CKRS1 test.

