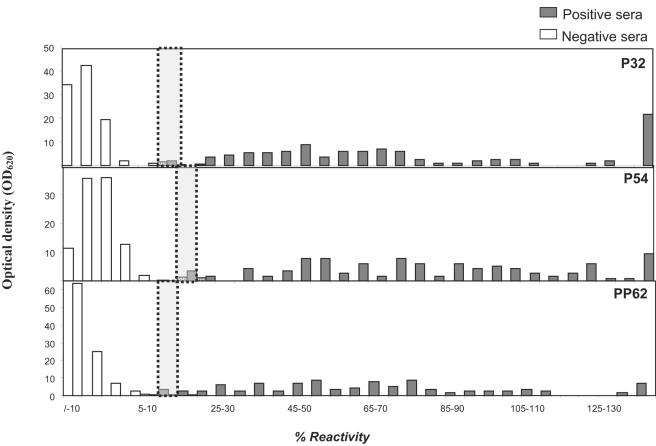
FIG. 4.
Distribution of the percentage of reactivity in 5% intervals, of field ASFV-positive and -negative swine sera. Duplicate serum samples were diluted 1:20 and analyzed by rP-ELISAs (p30, p54, and pp62). Each bar corresponds to the percentage of sera scoring within a 5% reactivity interval. The dotted lines indicate the cutoffs of the assays, while white and gray bars represent negative and positive sera, respectively, as classified by MS-ELISA and IB (OIE reference tests).

