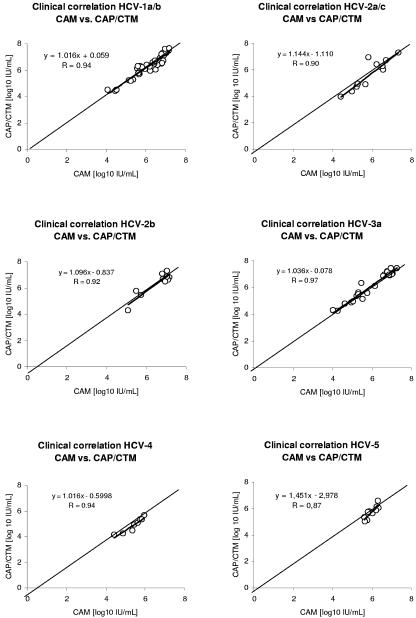
FIG. 1.
Correlation of HCV RNA concentrations of clinical samples between the CAM and the CAP/CTM assays. Results are shown separately for HCV genotype 1a/b, 2a/c, 2b, 3a, 4, and 5 samples. In addition to the single HCV RNA concentrations, the identity line and the regression line (boldface) are shown.

