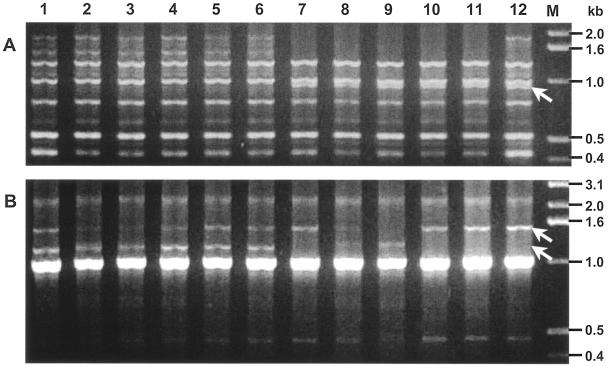
FIG. 1.
Representative RAPD fingerprint patterns. The profiles shown here were generated with DNAs from five single colonies and a pool of colonies. Lane M, molecular size markers (sizes shown are 0.4, 0.5, 1.6, 2.0, and 3.1 kb); lanes 1 to 6, pool and five single colonies from biopsy samples; lanes 7 to 12, equivalent cultures from a string test of the same patients. The profile in panel A was generated with RAPD primer 1281 and was chosen to illustrate a case of subtle but real difference between predominant genotypes of strains cultured from biopsy specimen versus string test: the lower polymorphic band in the 0.9-kb doublet is identified by an arrow in lane 12. (The additional differences in yield of RAPD products ≥1.8 kb long may reflect differences in size of genomic DNAs used for RAPD analyses and not differences in strain genotype.) The profiles in panel B were generated with primer 1283, are from another subject, and were chosen to illustrate heterogeneity among isolates (in this case, presence/absence of 1.2-kb and 1.5-kb bands in isolates from string).

