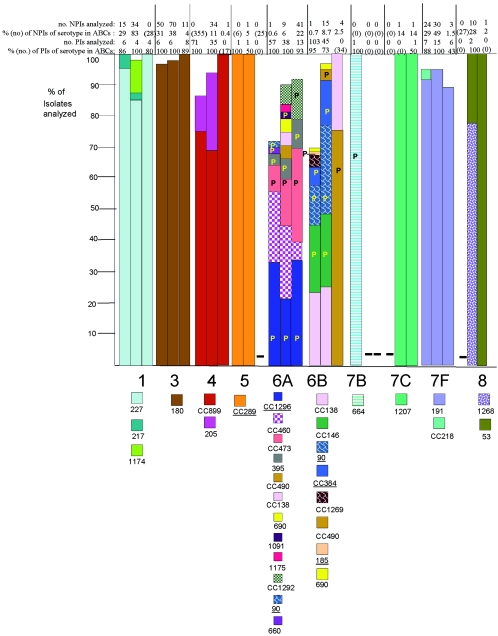
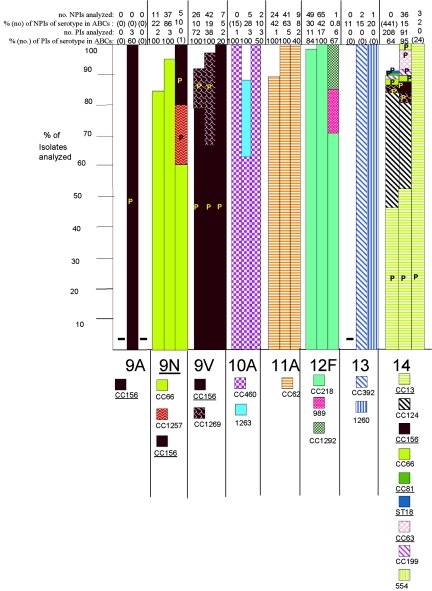
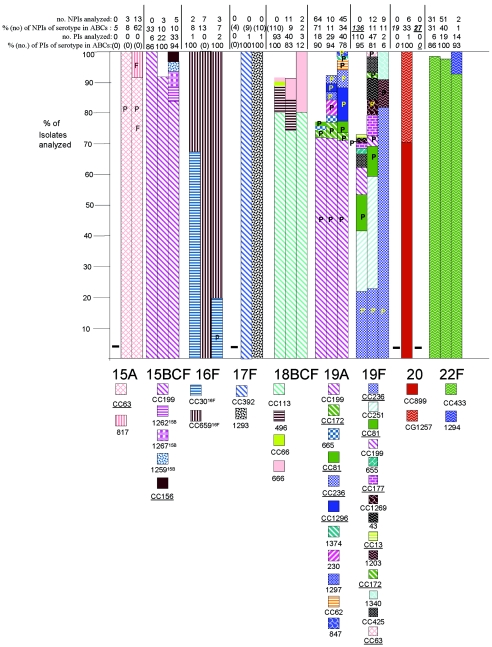
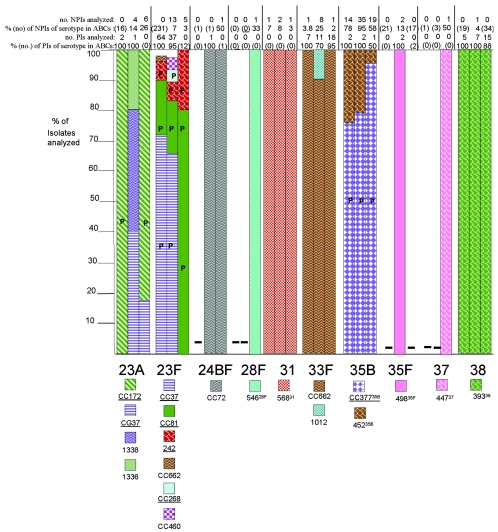
FIG.2.
Clonal compositions of individual serotypes from invasive surveillance. The left, middle, and right columns represent isolates recovered in 1999, 2001, and 2002, respectively. The NPIs analyzed depict the numbers of isolates from individuals 5 years of age or older that were subjected to PFGE. The PIs analyzed depict the numbers of isolates from individuals less than 5 years of age that were subjected to PFGE. The percentages depict the proportions of invasive pneumococcal isolates within these serotypes that were subjected to genetic analysis. Where the numbers corresponding to these percentages are in parentheses, they refer to the total numbers of ABCs isolates within that age and serotype. The letter P indicates that at least 15% of the indicated clonal set within the indicated serotype were penicillin nonsusceptible. Serotypes in parentheses are shown when the serotype distributions listed in the global database (28) differed in any way from what we observed. Underlines indicate STs directly shared by PMEN clones (27) or clonal complexes containing these STs found among PMEN clones. Up to 30% of the isolates within a given serotype had unique PFGE profiles and were not subjected to MLST (represented by gaps in the columns). Such isolates could possibly belong to any of the clonal sets included or could represent additional clonal sets.


